This feature displays the activity in your pharmacy using customizable color-coded information displayed on the screen. Here, you have the ability to view information about the ECS, Mail, Tickler and Workflow queues. Within these queues, you can set thresholds that inform you when things are approaching a critical stage. These are color-coded (green, yellow, and red) to indicate their importance in workflow. Additionally, when you click a certain value, you are taken directly to that queue. You also have the option to prioritize the Pharmacy at a Glace screen so that whatever needs immediate attention is moved to the top of the screen.
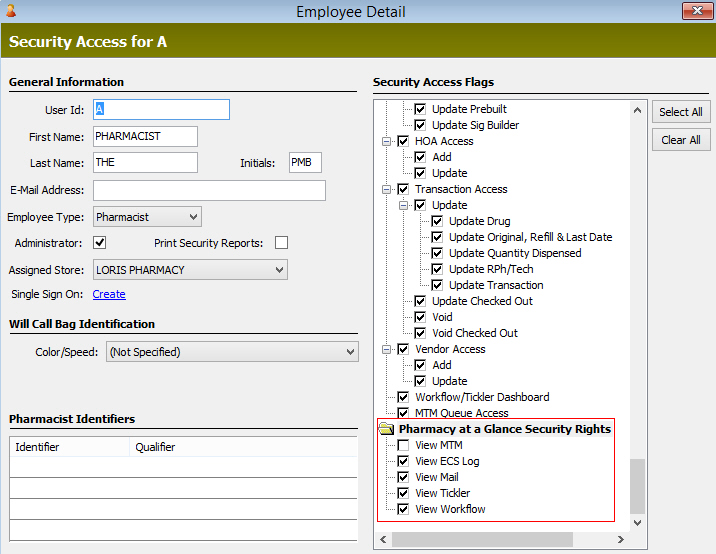
Employees will need Security Rights to access Pharmacy at a Glance. The employee (RPh and/or Tech) must log out and log back in to activate the new security rights for access to Pharmacy at a Glance.
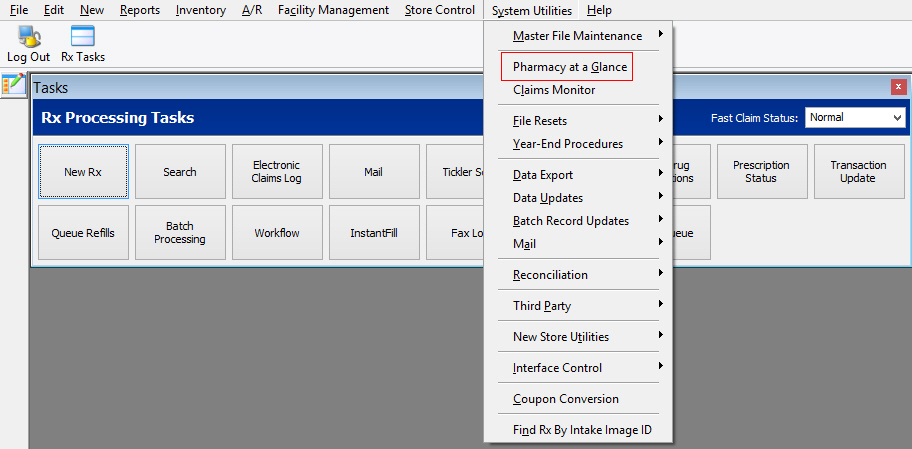
From the PrimeCare menu bar, select System Utilities and Pharmacy at a Glance.
The Pharmacy at a Glance splash screen appears while connecting to the
QS/1 Web Services Gateway Web Service.
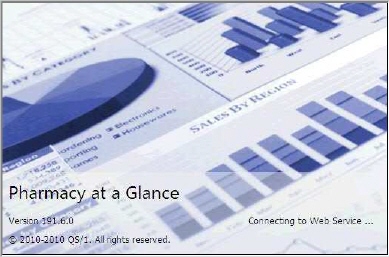
Once connected, Pharmacy at a Glance displays to the right of the client
window.
File Menu
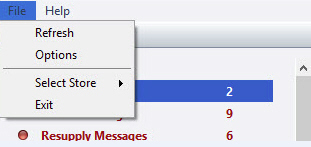
Refresh
Click Refresh and the web service refreshes the data displayed in the dashboard.
General
From the Pharmacy at a Glance menu
bar, select Options and General to set the minutes to download
content for each category.
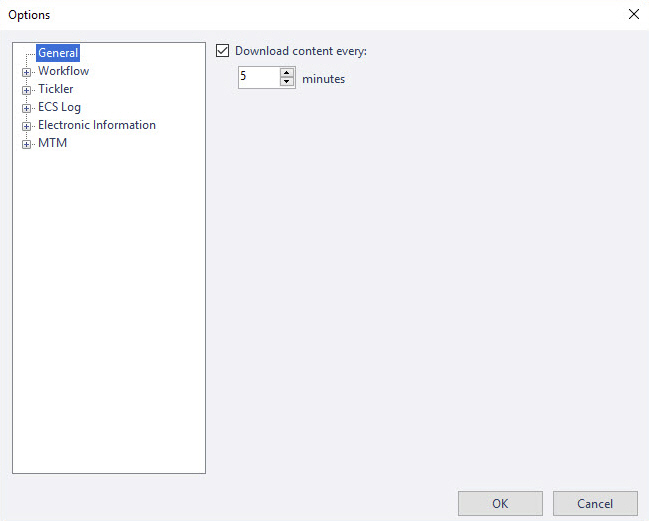
Click OK.
Display
From the Pharmacy at a Glance menu bar, select Options to set the download frequency for each category.
Click Display
to select from Workflow, Tickler, ECS Log and/or Electronic Information
categories to set options.
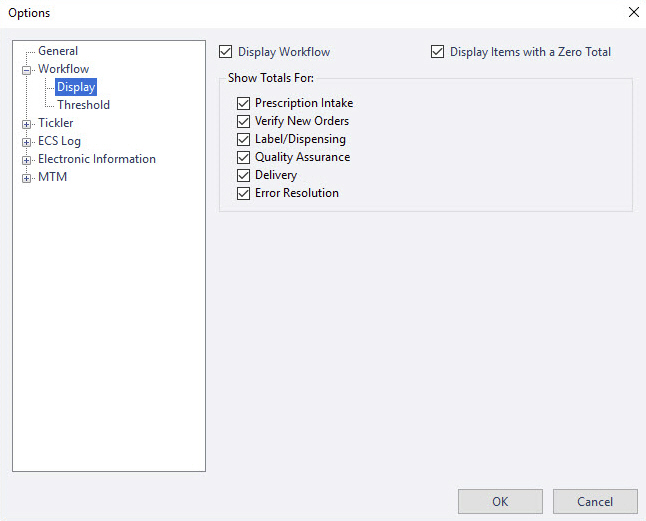
Check the items to display on the Pharmacy at a Glance dashboard or uncheck the Display field to omit the function from the dashboard.
Uncheck Display Items with a Zero Total to display only the items with a number. To see items in the same order, keep this box checked and the system displays all categories, even if there is nothing in that queue.
Threshold
Click Threshold under each category to set the Warning and Critical threshold counts.
Type the number of items in each category
to trigger the warning and critical levels on the dashboard. Once
the queue meets those thresholds, the colors for that category changes
on the Pharmacy at a Glance counter screen. These thresholds are set
for each workstation. What is critical for one person at one station,
may not be critical for someone at another.
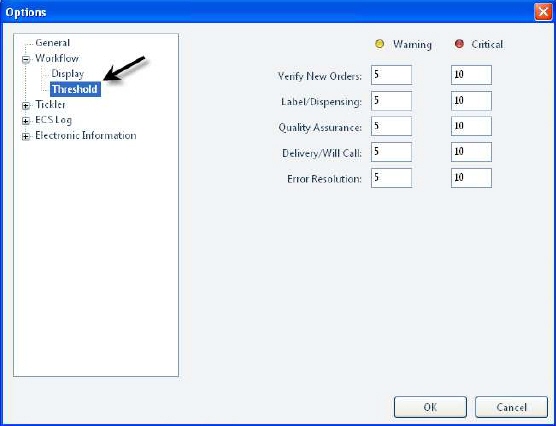
Click OK.
Select Store
Click Select Store
to choose to display all stores or select a specific store.
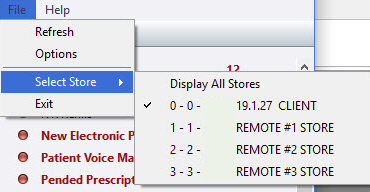
Exit
Click Exit, to exit the Pharmacy at a Glance application.
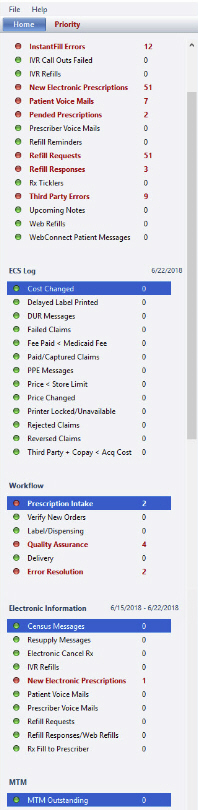
Home - Counter Screen
Green - everything is OK.
Yellow - indicates a warning level.
Red - a particular queue has reached a critical point.
Click one of the options on the counter screen and it automatically takes you to that queue. This allows you to view the specific items that are holding, allowing you to ask questions about the critical levels.
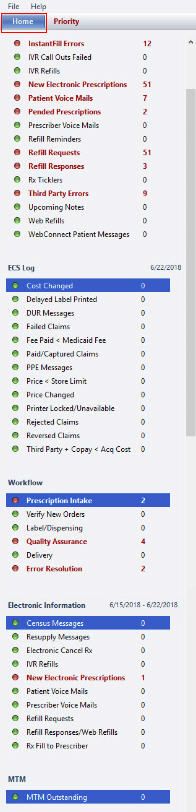
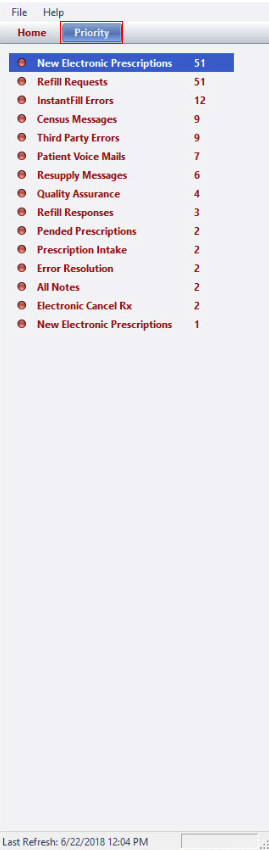
Priority
To scrutinize the numbers closer, click the Priority tab. This sorts everything based on priority. Critical items are shown at the top and work their way down to the items with warning thresholds. Click the queue to open and view the details.